Unlocking Fair Value of Stocks
2024-03-05
Last update on 2024-04-15
Mastering Comparable Company Analysis (CCA) and Market Multiples Method for Accurate Stocks Valuation
The multiplier method is a technique used to estimate the fair value of a company based on a multiple of its financial metrics, such as earnings, revenue, or book value. In this article we want to discuss how you can calculate the fair value of a company with practice example. Later we want to present you a platform that helps you to calculate these values much faster to make a faster investment decision.

As a general rule, the smallest possible value should be considered positive. The decisive factor is always the comparison with companies in the same sector. Meaningful comparisons with companies in other industries are not possible.
What are common multiplies?
The choice of the multiple depends on several factors, including the industry, company size, growth prospects, risk profile, and prevailing market conditions. Multiples can vary widely across different industries and companies within those industries.
EV/EBITDA indicates how long it takes a company to generate its own enterprise value. EV/EBIT indicates when the entire enterprise value could be 'repaid' from current profits. EV/Revenue indicates how many annual sales are required to cover the enterprise value of the company once.
How to calculate a fair value based on multipliers?
We use industry medians of valuation multiples like EV/EBIT, EV/EBITDA, and EV/Revenue to calculate a fair value is a common approach in valuation analysis. Let's break down the process:
Calculate industry medians
Determine the median values of the selected valuation multiples (EV/EBIT, EV/EBITDA, EV/Revenue) across the industry. This involves collecting relevant financial data from companies within the industry and calculating the median multiple for each valuation metric.
Apply the multiples
Multiply the industry median multiples by the corresponding financial metric of the company being valued (EBIT, EBITDA, Revenue). For example, if the industry median EV/EBIT multiple is 10 and the company's EBIT is $5 million, the 'fair value estimate' using this method would be $50 million ($5 million x 10).
Divide fair value by outstanding shares
After calculating the fair value estimate using the valuation multiples, divide that value by the total number of outstanding shares of the company. This division gives you the fair value per share, representing the estimated intrinsic value of each share of the company. For example, if the fair value estimate for the company is $50 million and there are 10 million outstanding shares, the **fair value per share would be $5** ($50million / 10 million shares).
Repeat for each metric
Repeat the process for each valuation metric. If you have industry median multiples for EV/EBITDA and EV/Revenue, apply those multiples to the respective financial metrics of the company to calculate fair value estimates.
Assign equal weights
Since you want to assign equal importance to each multiple, take the average of the three fair value estimates obtained. Add up the fair values derived from each multiple and divide by 3 to get the average fair value. For example, let's say the fair value estimates using the three multiples are $60 million, $70 million, and $80 million, respectively. Adding these values together gives a total of $210 million. Dividing this sum by 3 yields an average fair value of $70 million. Divided by 10 million shares gives a fair value of $7.
Common assumptions for the approach
The multiplier method, like any valuation method, is based on certain assumptions. Here are some key assumptions underlying the multiplier method:
Comparable companies
The method assumes that there are comparable companies or transactions available for comparison. These comparable entities should have similar financial performance, growth prospects, risk profile, and industry dynamics to the company being valued. The quality and relevance of the comparables are critical to obtaining accurate valuation estimates.
Market efficiency
The method assumes that the market accurately reflects the value of comparable companies. It assumes that the multiples derived from market prices or transaction values are appropriate and reflect the fair value of those companies. However, it's important to note that markets may not always be perfectly efficient, and there can be variations in pricing that could impact the reliability of the multiples.
Homogeneity of financial metrics
The method assumes that the financial metrics used for the multiples (such as earnings, revenue, or book value) are comparable across companies. It assumes that there are no significant differences in accounting practices, revenue recognition methods, or financial reporting standards that would distort the comparability of the financial metrics.
Static conditions
The method assumes that the valuation multiples remain constant over time. It assumes that the market conditions and industry dynamics will not change significantly during the valuation period. However, this assumption may not hold in rapidly evolving industries or during periods of market turbulence.
No unique factors
The method assumes that there are no unique factors or circumstances specific to the company being valued that would warrant a deviation from the average multiples of comparable companies. Unique factors, such as proprietary technology, competitive advantages, or significant pending events (mergers, acquisitions, regulatory changes), may necessitate adjustments to the multiples.
Let's practice this for Coca Cola (KO)
Identify the industry of Coca Cola (KO). We know that KO is in the industry group of Beverages - Non-Alcoholic.
Identify the competitors (comparable companies) of Coca Cola (KO). There are often called peers, but we have ensure that they have a similar market capitalisation to make them comparable. For Coca Cola (KO) the main competitors are PepsiCo (PEP) and Monster Beverage (MNST). On the peers page of Coca Cola (KO) you'll find these and other competitors.
Now we have to calculate the multiplies for EV/EBIT, EV/EBITDA and EV/Revenue. That means we have to do some research about the Enterprise Value, EBIT, EBITDA and Revenue for each competitor including Coco Cola (KO). To simplify that calculation, I just did a research for Coca Cola (KO), PepsiCo and Monster

Now we have to calculate the industry ratios (multiplies) for these 3 companies. That are:
        EV/EBIT = (24,3741+ 24,4497 + 15,9049) / 3 = 21,57
         EV/EBITDA = (22,1531 + 19,2764 + 15,9049) / 3 = 19,11
         EV/Revenue = (7,1234+ 3,2954 + 3,9938) / 3 = 4,80
Now we need EBIT, EBITDA, REVENUE for Coca Cola (KO)
        EBIT = 12568000000
         EBITDA= 13828000000
         REVENUE = 43004000000
OK, we are ready to do the math:
        Fair Value of Coca Cola = EBIT * EV/EBIT (Industry Median)
         = 12568000000 * 21,57
         = 271.091.760.000 $
         Fair Value of Coca Cola = EBIT * EV/EBITDA (Industry Median)
         = 13828000000* 19,11
         = 264.253.080.000 $
         Fair Value of Coca Cola = EBIT * EV/REVENUE(Industry Median)
         = 43004000000* 4,80
         = 206.419.200.000 $
well, you may be interested in the fair value by share - to calculate that we just need to divide the values be the the number of shares of KO: 4350000000 (at end of 2022)
        Fair Value based on EBIT / Shares
         = 271.091.760.000 $ / 4350000000
         = 62,32 $
         Fair Value based on EBITDA / Shares = 264.253.080.000 $ / 4350000000
         = 60,75 $
         Fair Value based on Revenue/ Shares = 206.419.200.000 $ / 4350000000
         = 47,45 $
By assigning equal weights to the multiples and taking the average fair value, you are essentially giving equal importance to each valuation metric in determining the fair value estimate for the company.
Averaged Fair Value = (62,32 $ + 60,75 $ + 47,45 $) / 3 = 56,84$ Through the power of Comparable Company Analysis (CCA), we have calculated Coca-Cola's (KO) fair value, shedding light on its intrinsic worth. Our meticulous analysis has determined that Coca-Cola's fair value stands at $56.84 per share, providing investors with valuable insights for informed decision-making.
WOW isn't that time consuming?
Calculating the fair value of a company can indeed be a time-consuming process, especially when conducting thorough research and analysis. It requires gathering financial data, researching comparable companies, selecting appropriate valuation multiples, and applying them to the company's financial metrics. Additionally, considering qualitative factors and weighing different metrics can further add to the complexity and time required.
Your personal short path with marketstorylabs.com
However, using a platform like marketstorylabs.com can significantly streamline the process and save you time. Marketstorylabs.com provides a centralized platform where you can access industry medians, comparable company data, and valuation multiples. We calculating the fair value based on the Comparable Company Analysis for more than 5K stocks. It is just a click away.

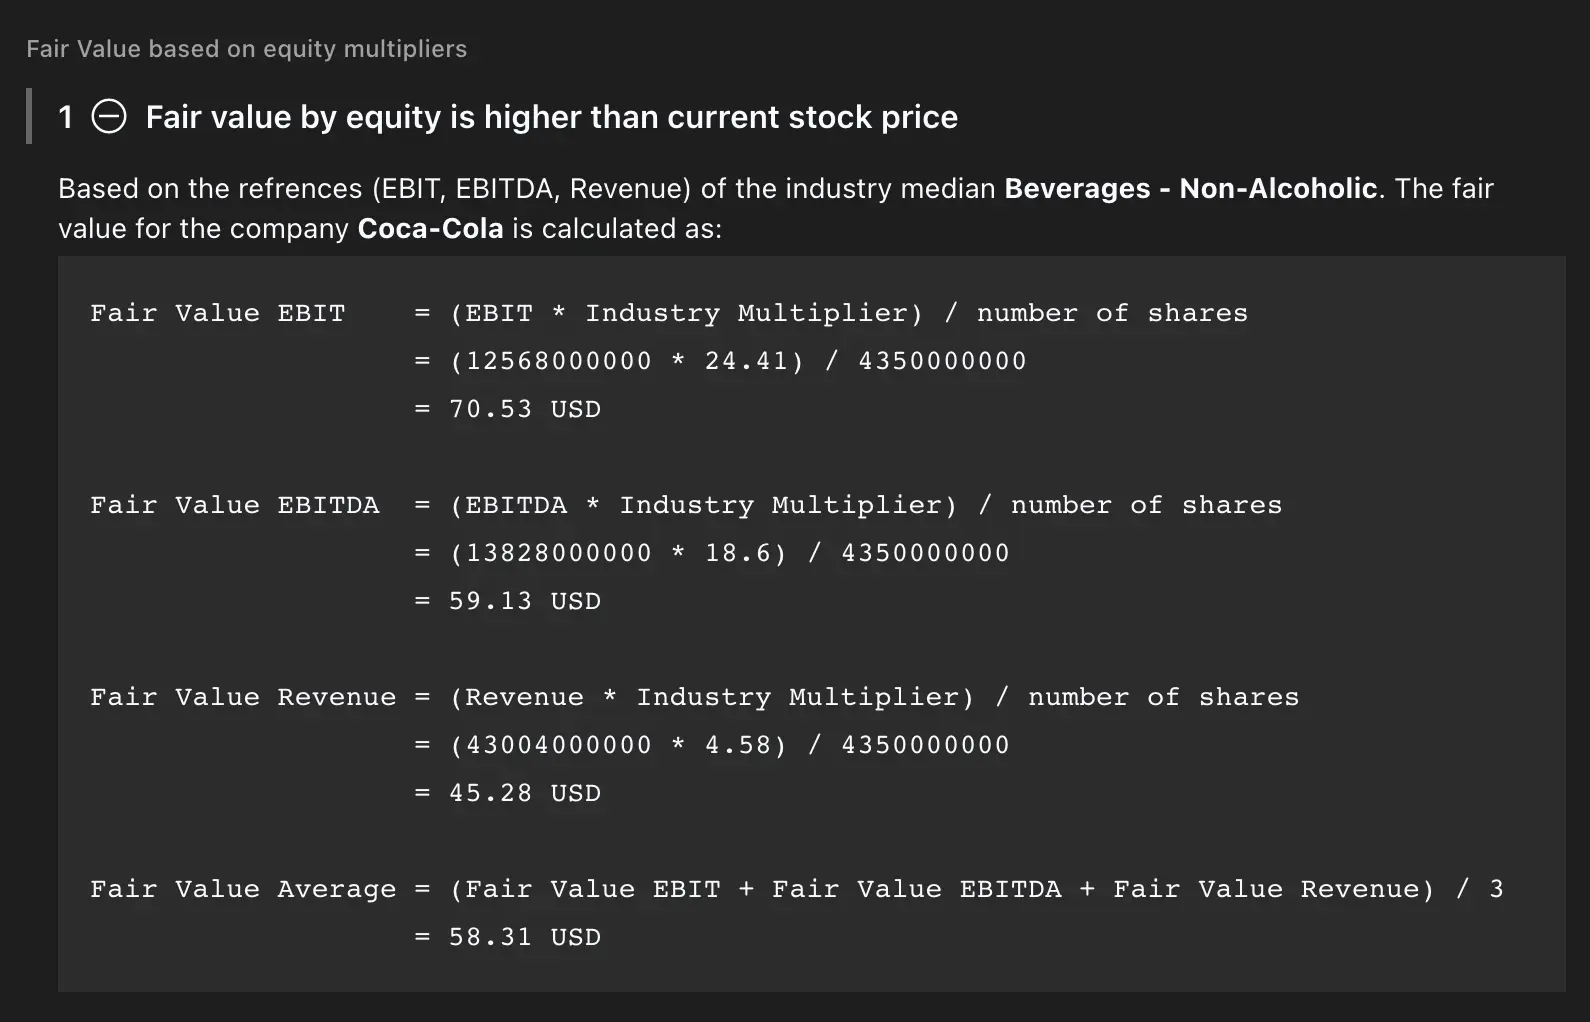
In the fist box we do the same calculation for Coca Cola (KO) as we did in this article.

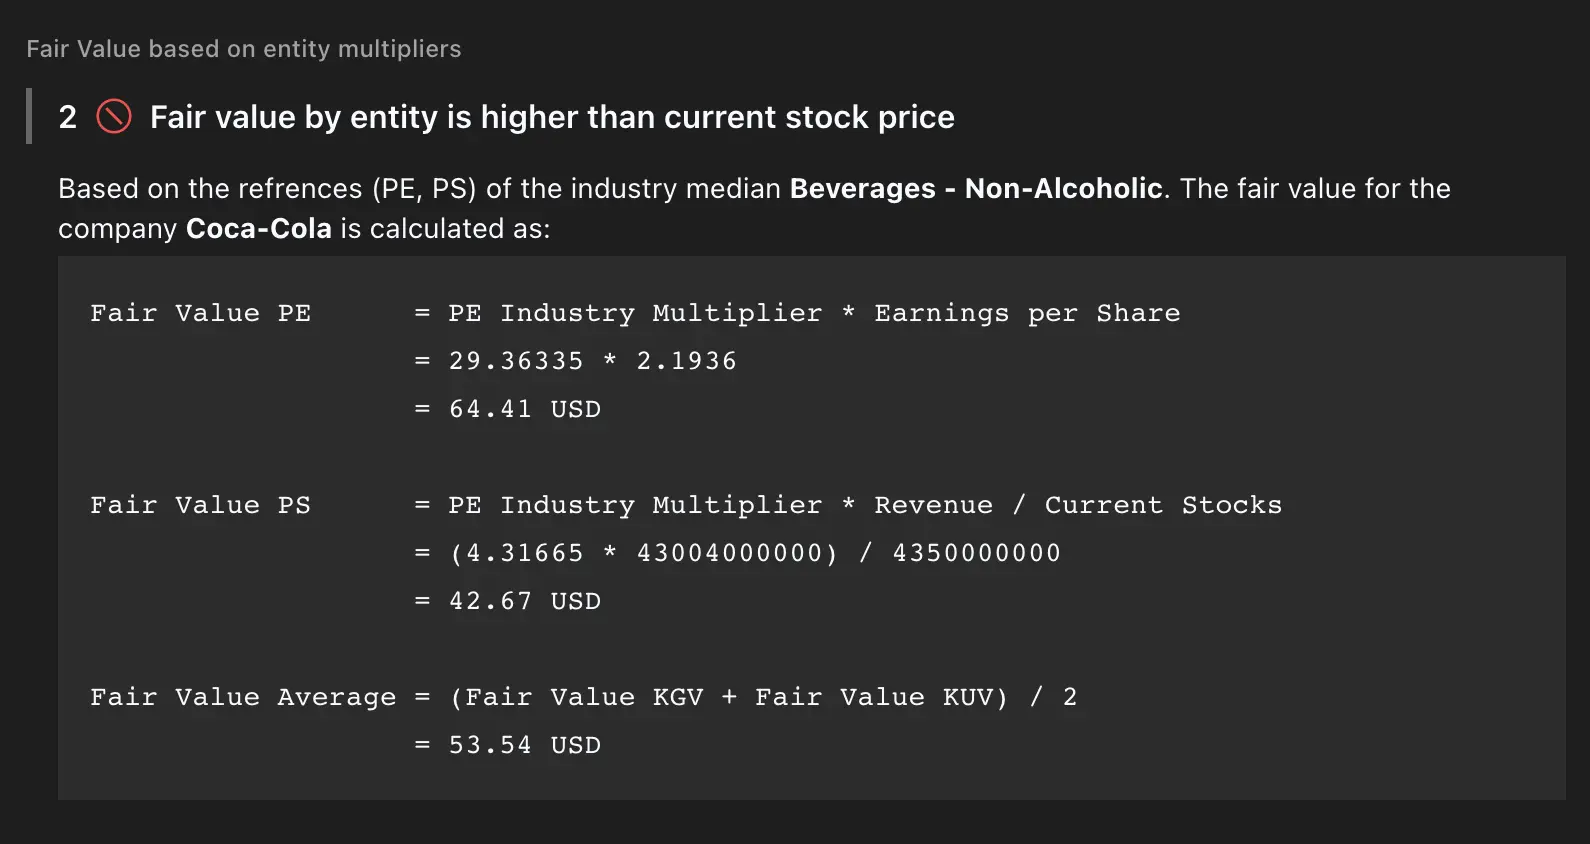
Indeed, you can use entity multipliers as well like the PE and PS ratio to calculate the fair value. A detailed calculationcan be found in the picture or directly on the marketstorylabs.com page.

marketstorylabs.com advices to use EV/EBITDA, EV/EBIT, PE and PS Ratio and strengthen you investment decision:
- Industry Comparison
Compare the company's EV/EBITDA, EV/EBIT, PE and PS Ratio multiples to the industry average or relevant peers. If the company's multiples are lower than the industry average, it may suggest an undervalued stock. Conversely, if the multiples are higher, it may indicate an overvalued stock. - Historical Analysis
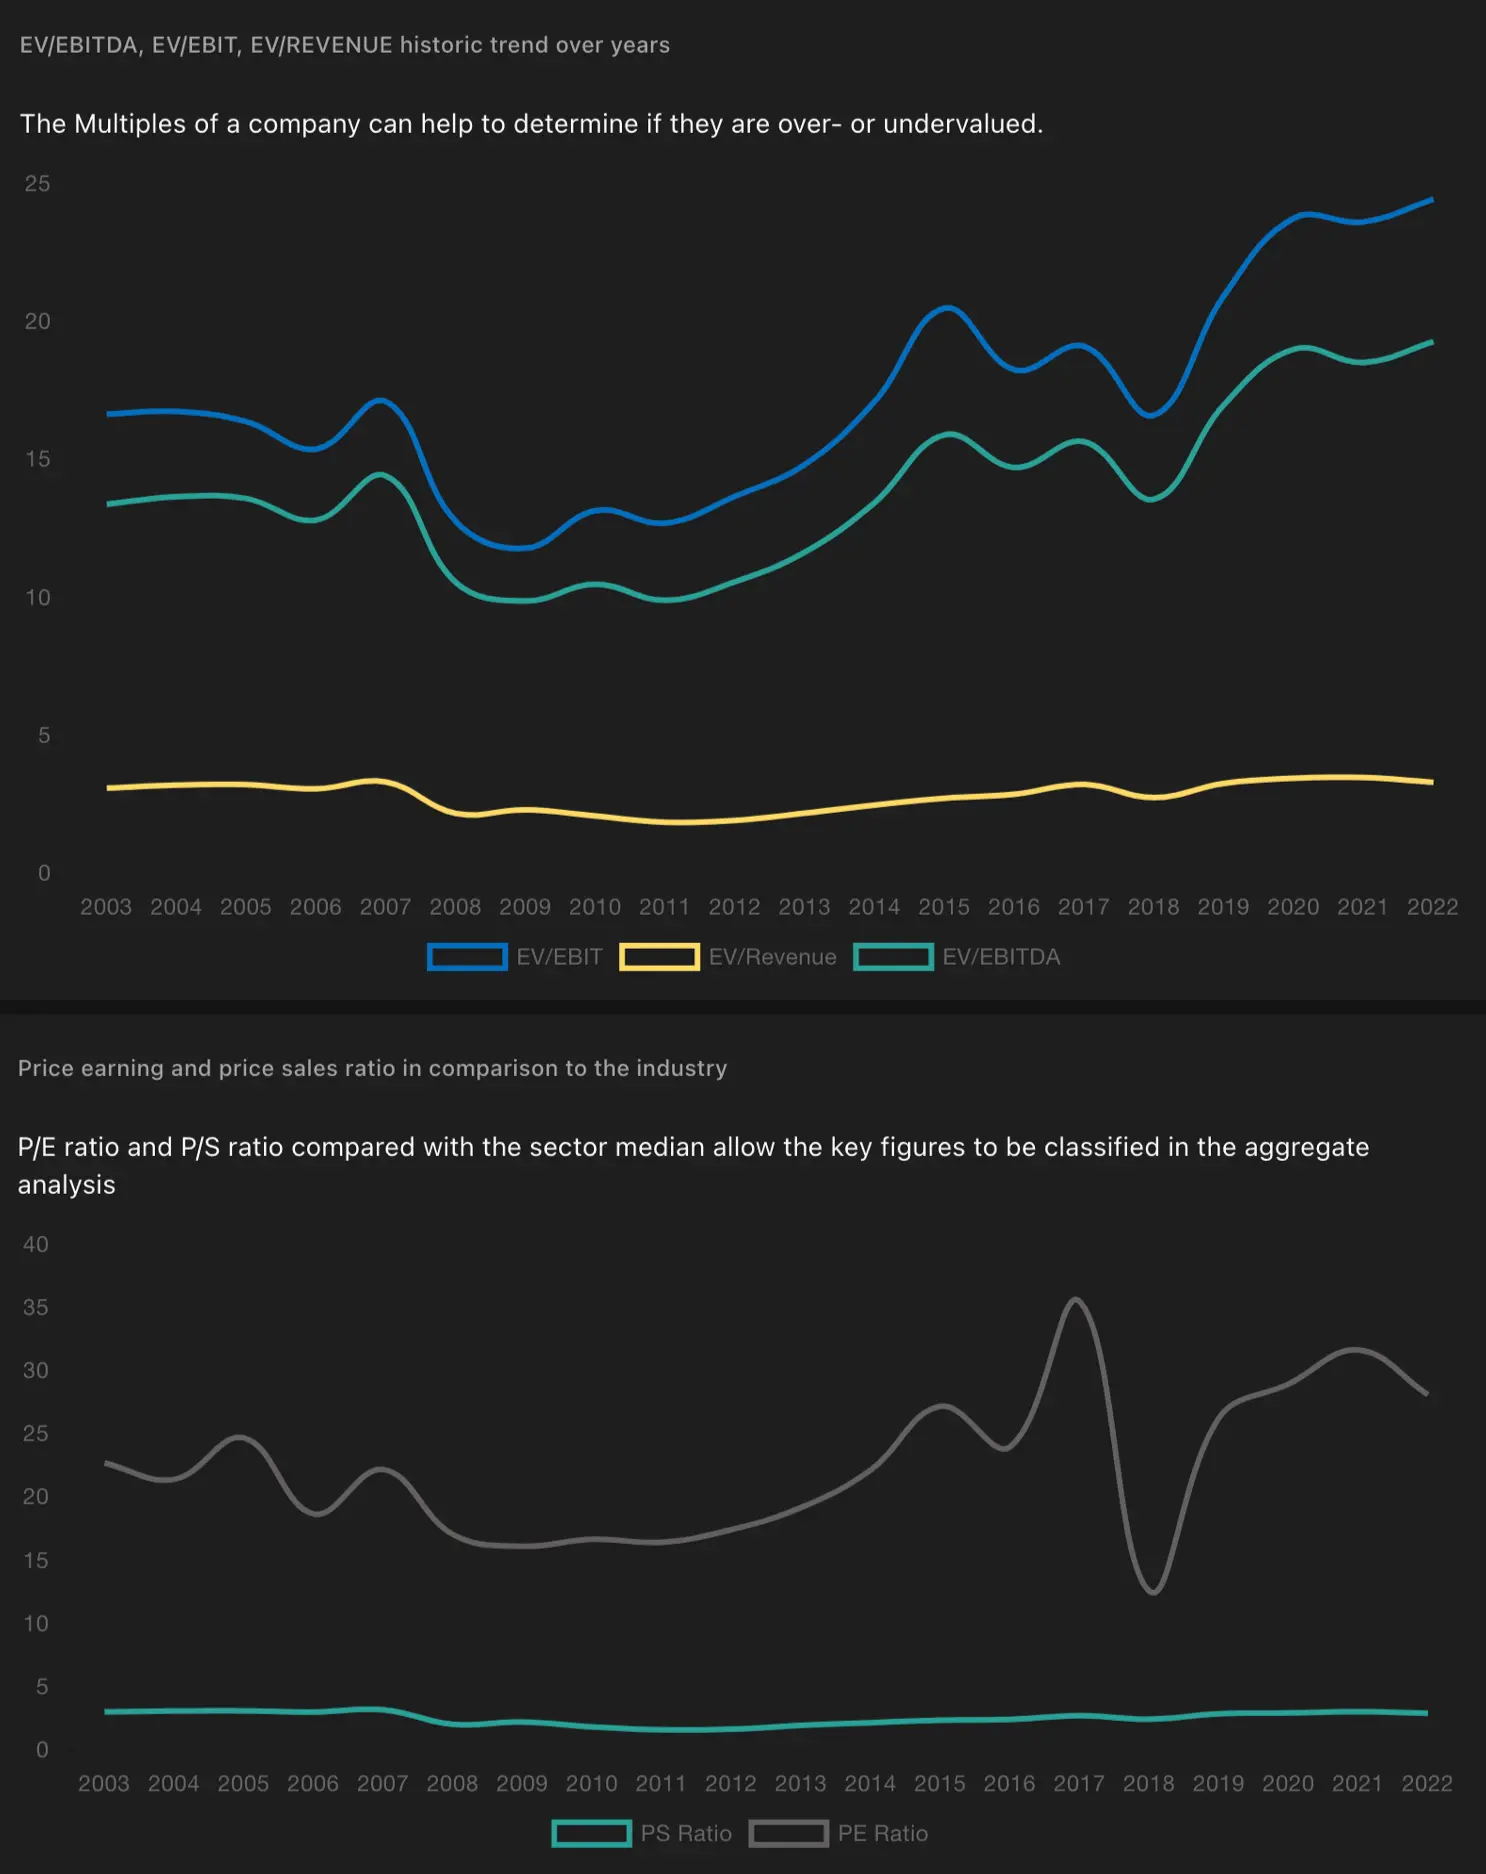
Examine the company's historical EV/EBITDA, EV/EBIT, PE and PS Ratio multiples over time. If the current multiples are significantly below the historical averages, it might indicate an undervalued situation. Conversely, if the multiples are much higher than historical levels, it could suggest an overvalued scenario.

Conclusion
Calculating fair value using the Comparable Company Analysis method is a vital step in successful investing. With marketstorylabs.com, you can revolutionise your valuation process and supercharge your investment decisions. Say goodbye to manual calculations and data overload. Embrace the power of our advanced tools and comprehensive insights to simplify your investment strategy and unlock new opportunities in the financial market.
Start on your path to financial success by exploring the world of stocks on marketstorylabs.com - simple, proficient, and free.
Obligatory risk notice
We would like to point out that the contents of this website are for general information purposes only and do not constitute recommendations for the purchase or sale of specific financial instruments, and therefore do not constitute investment advice. In particular, marketstorylabs.com and its creators cannot assess the extent to which information / recommendations made on the pages correspond to your investment objectives, your risk tolerance and your ability to bear losses. Therefore, if you make any investment decisions based on information on the site, you do so solely on your own responsibility and at your own risk. This in turn means that neither marketstorylabs.com nor its creators are liable for any losses incurred as a result of investment decisions based on the information on the marketstorylabs.com website or other media used.